Mastering Written Reports: Effective Data Storytelling Techniques for Business Success (Data…
Learn how to create impactful written reports with these proven data storytelling techniques. Master report structuring and targeting

Mastering Written Reports: Effective Data Storytelling Techniques for Business Success (Data Storytelling Volume II)
Harnessing Insights through Effective Report Writing Techniques
As a business professional or data analyst, you play a pivotal role in transforming raw data into actionable insights. Your expertise and skills are the key to making written reports more than just documents — they become tools that can drive impactful decisions and shape the future of your organization.
In this volume of Data Storytelling, we focus on written reports, a cornerstone of professional communication. Building on Volume I: Creating Stories from Data: A Guide to Impactful Communication, where we explored how to craft compelling narratives from numbers, we now turn our attention to mastering the techniques of writing effective reports. Whether you’re delivering detailed analyses or summarizing findings for key stakeholders, the ability to create clear, engaging, and actionable written reports is a skill worth honing.
Why Focus on Written Reports?
Written reports allow you to explore data in depth, making them ideal for audiences that need time to process information. Their structured nature ensures clarity, relevance, and long-term value.
Key Advantages of Written Reports
- Extensive Details: Include thorough explanations supported by charts, tables, and appendices.
- Permanent Reference: Serve as a resource for future review and decision-making.
- Reader-Paced Engagement: Empower readers to digest information at their own pace.
- Complete Documentation: Provide transparency with detailed methods, data sources, and justifications.
To make your reports stand out, you must balance depth with clarity and tailor content to your audience.
Types of Written Data Reports for Business Communication
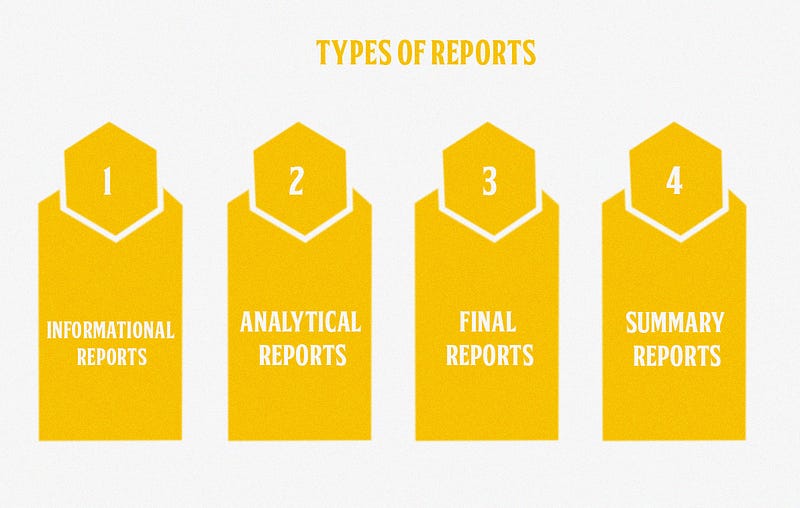
Reports generally fall into the following categories:

- Informational Reports: Deliver factual data without analysis.
Example: Quarterly website traffic metrics shared with stakeholders. - Analytical Reports: Present analyses, explore relationships, and offer recommendations.
Example: A customer feedback analysis identifying key satisfaction drivers. - Final Reports: Comprehensive and technical, covering data, methodologies, and visualized findings.
Example: A year-end performance evaluation for a marketing campaign. - Summary Reports: Offer concise overviews of findings and recommendations, ideal for decision-makers.
Example: An executive summary for a board meeting highlighting key insights and next steps.
Structuring Analytical and Final Reports for Maximum Impact
For analytical or final reports, a clear and logical structure enhances readability and accessibility. Here’s a recommended framework:

- Introduction
- Purpose of the Report: Clearly state the report’s purpose and relevance.
- Contextual Information: Provide background, such as challenges or opportunities prompting the analysis.
- Analysis Questions: Summarize the report’s key questions (e.g., “What factors contribute to delayed shipping?”). - Body
- Data Section: Present the key data in tables or summaries.
- Methods: Describe the methodologies (e.g., NLP algorithms for text analysis).
- Analysis: Share insights enhanced with visuals like trend graphs.
- Results: Explain findings clearly. For example, “30% of negative reviews cited ‘delayed shipping.’” - Conclusion
Recap the main points, restate the analysis questions, and offer actionable recommendations.
Example: “Focus on streamlining shipping processes to reduce delays.”
Tailoring Reports to Stakeholders
Consider the 1–3–25 format for business contexts:
- 1-page abstract: Summarizes key findings.
- 3-page executive summary: Provides an overview for decision-makers.
- Up to 25 pages: Offers technical depth for analysts.
Audience Considerations:
- Time-Pressed Stakeholders: Prioritize the introduction and conclusion.
- Executives: Focus on actionable recommendations.
- Technical Audiences: Provide detailed methodologies and raw data insights.
Ensuring Credibility and Transparency in Reports
Credibility and transparency are paramount in business reporting. While reproducibility and replicability are essential in scientific research, in the business context, ensuring that your data and methods are clear and well-documented is equally important for maintaining trust and making your reports actionable.
Best Practices for Credibility:
- Document Your Methodology: Clearly outline how you analyzed the data. This enables others to follow your logic, even if they use different tools or systems.
- Provide Source Transparency: Always mention the sources of your data, whether it’s internal company data, third-party datasets, or publicly available information.
- Cite Your Sources: Referencing studies, industry reports, or even internal company documents adds credibility to your report and helps readers verify your claims.
- Use Version Control: Even in business contexts, version control tools like Git can help manage different iterations of your report, especially if multiple people are involved in the process.
- Avoid Data Manipulation: Ensure your data analysis process is as objective and transparent as possible, avoiding any subjective alterations that could skew the results.
Practical Tips for Writing Reports
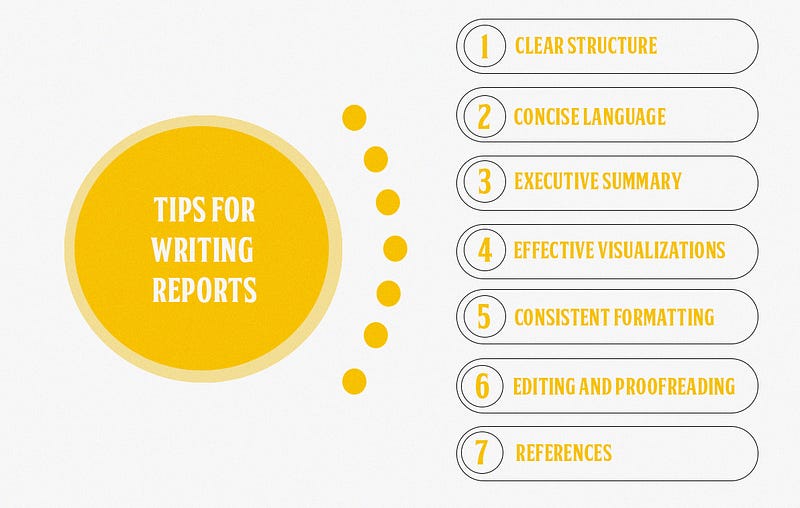
These practical tips are designed to make your report-writing process more efficient and effective. By following these guidelines, you can ensure that your reports are clear, concise, and impactful.

- Clear Structure: Use headers and subheadings for organization.
- Concise Language: Minimize jargon; explain technical terms.
- Executive Summary: Highlight key points at the beginning.
- Effective Visualizations: Use graphs and tables to clarify findings.
- Consistent Formatting: Maintain uniform font styles, sizes, and layouts for professionalism.
- Editing and Proofreading: Polish for grammar, spelling, and formatting errors.
- References: Cite all sources to enhance credibility.
Wrapping Up: The Power of Written Reports
Well-structured written reports are not just tools for conveying data insights; they are indispensable for influencing and driving strategic decisions. With a well-structured approach and attention to audience needs, your reports can inform, influence, and drive strategic decisions.
But storytelling doesn’t stop here — next comes the dynamic engagement of oral presentations.
Up Next: Oral Presentations — Bringing Data Stories to Life
In Volume III: The Art of Oral Presentations, we’ll explore how to transform static data into compelling narratives through verbal communication. Learn techniques to captivate your audience, tailor delivery for stakeholders, and make your insights unforgettable.
Further Reading
Here are some additional resources to deepen your understanding of report writing and data communication:
- “Storytelling with Data” by Cole Nussbaumer Knaflic: A practical guide to crafting data visualizations and stories that inform and inspire.
- “The Pyramid Principle: Logic in Writing and Thinking” by Barbara Minto: Learn how to structure your written and oral communication to enhance clarity and impact.
- “Effective Data Storytelling” by Brent Dykes: A comprehensive look at connecting data insights with compelling narratives.
These resources allow you to refine your reporting skills and maximize your data-driven insights.
